
Imagine telling shareholders, customers, or leadership that nothing improved this month and expecting applause. It sounds absurd. Yet that’s exactly how many organizations measure database success. In many ways a quiet month is a good month. However, a quiet month isn’t the finish line. It’s an opportunity to become more resilient, more efficient, and more secure.
Uptime Institute’s Annual Outage Analysis 2026, which tracks IT and data center outages, found that outage frequency per site has declined for the fifth year in a row. Stability is becoming the baseline, not the achievement. The outages that still happen, however, keep getting more expensive: 57% of respondents said their most recent major outage cost more than $100,000, and 1 in 5 put the figure above $1 million. So if you are working out how to measure a managed database services provider, “nothing broke” is where the conversation starts. It should not be where it ends.
Below are six questions that measure what a quiet month cannot, along with what a strong answer and a weak answer sound like.
What does “nothing broke this month” actually tell you?
It tells you the month ended without an incident. That is worth knowing, and it is not nothing. It is also a lagging, binary measure. It cannot tell you whether risk in your database environment went up or down while nobody was looking.

Routine database maintenance keeps a status report green. It does not, by itself, tell you what the report leaves out. Consider what a green status report can hide. A transaction log drive that is 70% full and growing a little every week. Index fragmentation that adds a few milliseconds to a critical query each month. A backup job that succeeds every night but has never been restored to prove it works. None of these is an incident yet. All of them show green. Databases are honest that way: the condition of the system reflects the care it received, whether or not the report does.
Ask a provider: what did you do to make my environment more stable, resilient, or efficient? And then follow up with, “What is the plan to achieve more in the next quarter?” A strong answer names specific conditions and their direction. A weak answer is “everything is green, no issues to report.”
How to measure a managed database services provider beyond uptime
Start by separating two kinds of measures. Lagging measures describe what already happened: uptime percentage, ticket volume, response times. They matter, and they belong in your agreement. Continuous monitoring produces them automatically, and any monitoring tool can chart them. Leading measures describe where the environment is heading: whether recurring problems are shrinking, whether performance is holding as data grows, whether recovery is proven rather than assumed. A provider that reports only the first kind is telling you about the past.
Leading measures need a starting point. You cannot show improvement against a baseline nobody wrote down. This is why onboarding matters more than most buyers expect. Fortified Data finishes a structured onboarding before go-live. It covers architecture, server health, configuration, capacity, and disaster recovery readiness for every database system in scope. The team also documents agreed performance goals and monitoring baselines, so each later review has a fixed point to measure from.
Ask: what baseline did you document when we started, and can I see today’s numbers next to it? A strong answer produces the document. A weak answer describes the baseline as “the environment we inherited,” which is a description, not a measurement.
Which database partner KPIs show the environment is getting better?
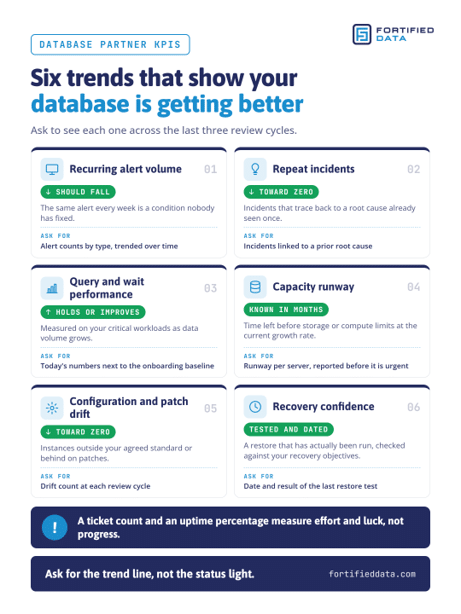
Useful database partner KPIs share one property: each one can trend in a direction you can see. Six are worth asking for.
The first is recurring alert volume. The same alert firing every week is a condition nobody has fixed, and the count should fall over time. The second is repeat incidents, meaning incidents that trace back to a root cause already seen once. That number should approach zero. The third is performance against established baselines, measured on the mission critical workloads your business depends on. This is where query optimization and performance tuning work either shows up or does not. It should hold steady or improve as data volume grows.
The fourth is capacity runway: how many months remain before storage or compute limits are reached at the current growth rate, whether the servers sit on premises or in a managed cloud service. A good partner reports it early, so resource allocation is a planned, data driven decision rather than an emergency purchase. The fifth is configuration and patch drift, meaning how many instances sit outside your agreed standard or behind on patches. The sixth is recovery confidence: the date of the last successful restore test, and whether it met your recovery point and recovery time objectives.
Ask: can you measure what is important to our organization? Can you measure trends across the last three review cycles? A strong answer is a trend line. A weak answer is a ticket count and an uptime percentage, which measure effort and luck, not progress.
Is the problem being fixed, or just patched?
I mean “patched” in the older sense here: the workaround, not the security update. Software patches are part of good operations. Workarounds that become routine are not.
Here is how the difference plays out. A reporting job fails at 2 a.m. every few weeks. Each time, someone restarts it, the job completes, and the ticket closes within its service level. The contract is satisfied. Nothing has been learned. The fix is to find out why the job fails, whether that is blocking from another process or a timeout that growth in the data has made inevitable, and then remove the condition so the job stops failing.
Consistency is what makes that possible. Uptime Institute’s 2026 analysis names failure to follow established procedures as the leading driver of outages caused by human error. Root-cause work only sticks when the fix becomes documented procedure that everyone on the team follows. That is a staffing model question as much as a database administration question. Every Fortified Data managed services client is assigned to a POD: a dedicated DBA team that shares documentation and knowledge of the environment, with a Strategic Account Manager alongside. When a problem shows up a second time, the team recognizes it as a pattern instead of treating it as a new ticket.
Ask: when an incident repeats, how do you track it, and what is your process for closing the root cause? A strong answer describes a record that links repeat events and a named step for removing the cause. A weak answer is “we resolved it within SLA,” every time.
Is there a written improvement plan, and who owns it?
Monitoring tells you what is happening. A plan tells you what happens next. Without one, proactive database improvement stays opportunistic: it happens when someone has spare time, which in most environments means it rarely happens at all.
A useful plan has three properties. It is written down. It is ranked, so the change with the most business impact comes first. It is owned by the provider, so improvements are delivered work rather than recommendations your own team is left to staff.
This is the part of our service I would point to first. After go-live, Fortified Data’s Select and Signature clients receive a Strategic Improvement Plan covering index strategy, performance, capacity, and data security. Each review cycle, the team takes the highest-impact condition identified through telemetry and that plan, and remediates it. The goal is to optimize performance and reduce risk in a deliberate order. It is also why our account reviews track completed improvements, not just system status.
Ask: what is on the plan for our next review cycle, and what did you complete in the last one? A strong answer names both. A weak answer is “we will recommend improvements as we find them,” or a list of findings with no one assigned to fix them.
What should proactive database improvement be worth to the business?
Trend lines are a means, not the point. What a CIO or CFO actually buys is what those trends turn into, and it lands in five places:
- Cost avoidance: The outage that was prevented costs nothing, and neither does the emergency project nobody had to staff. The result is reduced operational risk and fewer surprise purchases, because capacity gets bought when the numbers justify it.
- Cost control: Spend you can forecast, for less than the fully loaded cost of recruiting and retaining a full internal DBA team, plus licensing and cloud service consumption sized to what you really use.
- Security and stability: Current patches, tightened access controls, and configurations that match your standard on every instance. Problems get resolved before users feel them, and audit evidence is ready when a compliance review asks for it.
- Performance that scales: Capacity planning and tuning that stay ahead of business growth, whether that growth arrives as more data, more users, or more transactions.
- Continuous optimization: Month 12 should beat month 1 in ways you can check. Queries run faster, recurring alerts drop off, indexes get cleaner, and a written roadmap says what comes next.
A provider that cannot point to these results, from current clients or published case studies, is selling you a dashboard. For a practical starting point on the proactive side, see our guide to building a proactive database health strategy.
Six questions that measure a database partner
A quiet month is worth recognizing but not celebrating. Who wants to celebrate ‘nothingness’. It is not worth paying for on its own. Every environment has opportunities to improve resilience, efficiency, security, and performance. The greatest value often comes from preventing tomorrow’s problems today. That is a lot more than nothing!
Knowing how to measure a managed database services provider comes down to six questions:
- What changed in our environment since the last review, and did it get better or worse?
- What baseline did you document at onboarding, and how do today’s numbers compare?
- Can you show our database partner KPIs trended across previous review cycles?
- When an incident repeats, how do you find and remove the root cause?
- What is on the improvement plan for the next review cycle, and what did you complete in the last one?
- Can you show cost avoidance, cost control, security and stability, performance, and continuous optimization from current clients?
If you would like to see how your current environment measures against these six questions, talk with our team.
Sources
Uptime Institute, Annual Outage Analysis 2026 (press release, May 13, 2026): https://uptimeinstitute.com/about-ui/press-releases/uptime-announces-annual-outage-analysis-report-2026